Instead of wrestling with slow spreadsheets and unreliable reports, we build tools that actually save you time and show clear results. We've helped UK SMEs in logistics, manufacturing and distribution turn data chaos into competitive advantage - without agency prices or complicated setups.
Data that works for your business
Data, Simplified Clearly
At NovaXact, we turn tangled data into clear, actionable insights, helping UK businesses grow with ease and precision.


Our Projects
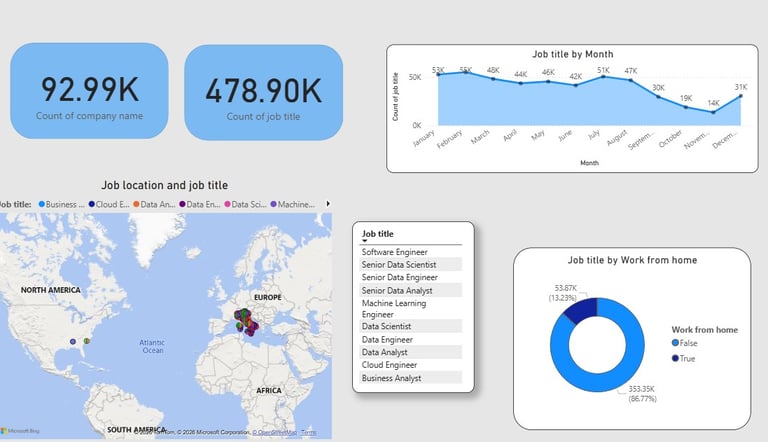
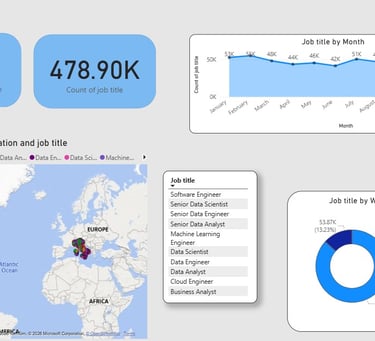
Power BI dashboard
Interactive Power BI dashboard combining global job market trends with geospatial mapping to deliver actionable industry insights.
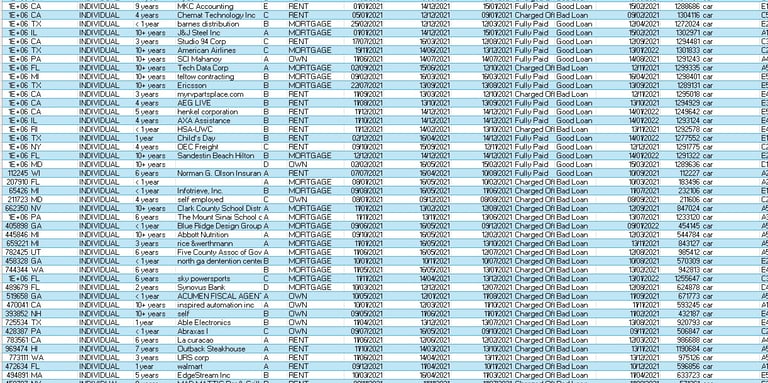
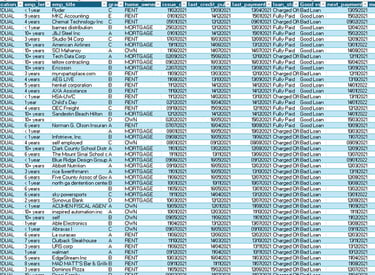
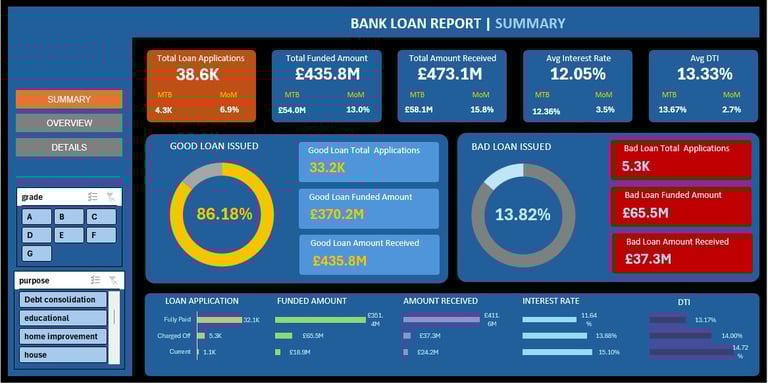
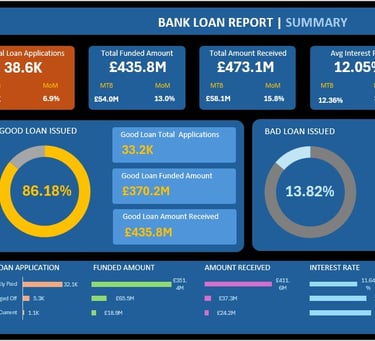
Dashboard in Microsoft Excel
Interactive financial dashboard built in Excel, transforming raw banking data into clean, executive-ready insights.
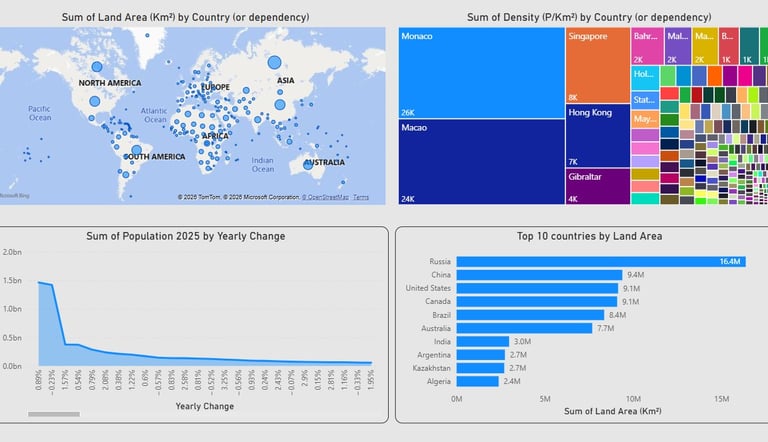
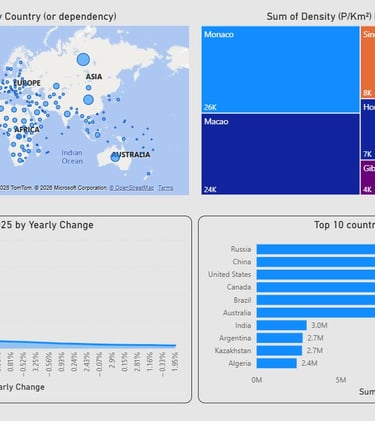
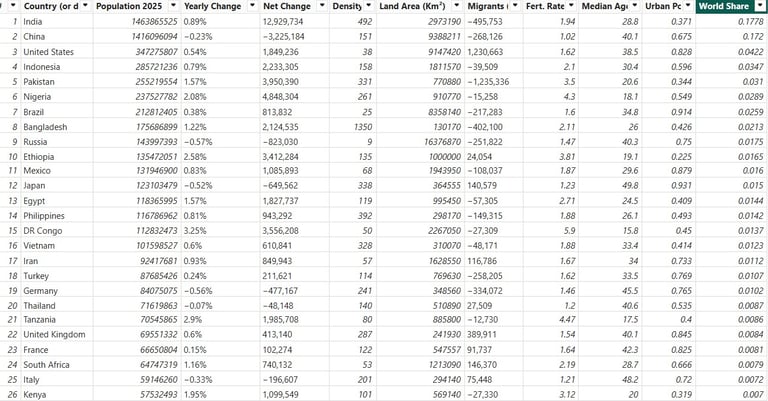
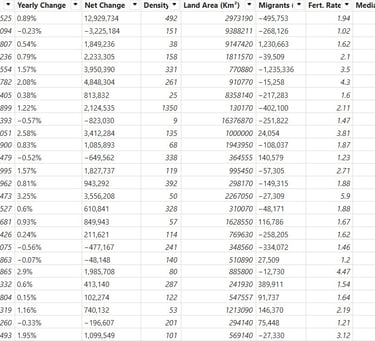
Power BI dashboard
Interactive Power BI dashboard designed for global demographic analysis, featuring geospatial mapping and density metrics.
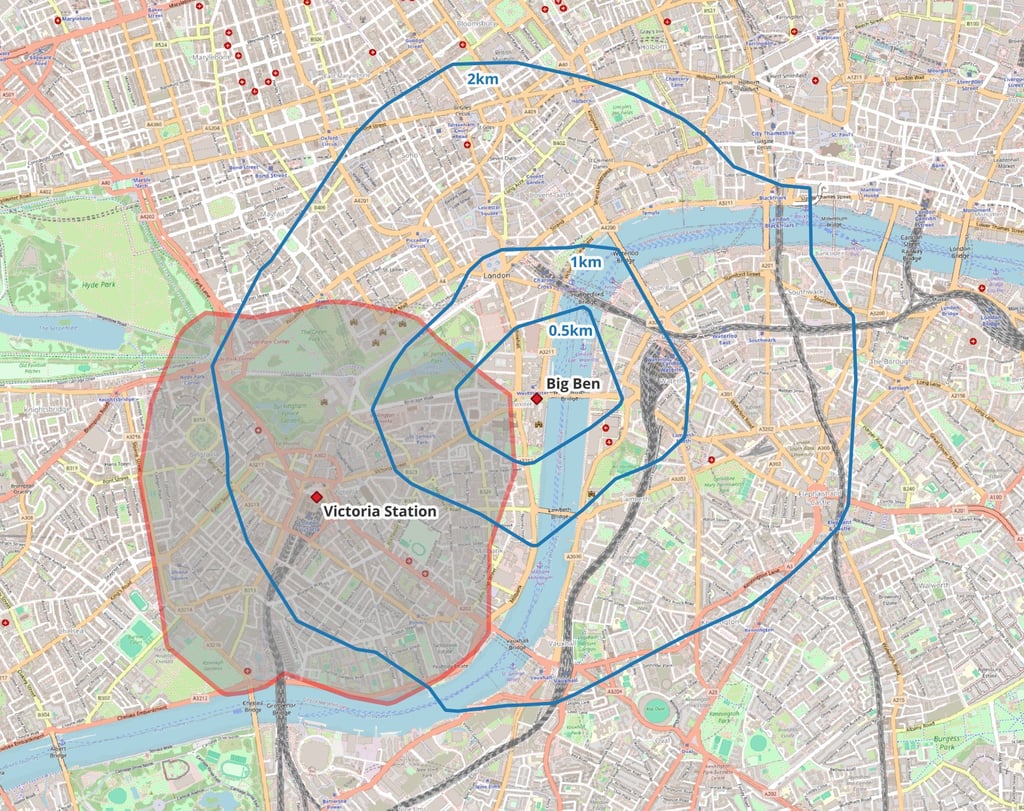
Mapping London on foot: Victoria Station vs Big Ben
Advanced QGIS network analysis mapping true pedestrian accessibility and urban mobility isochrones in Central London.
Ever wondered how far you can actually get in Central London on foot? Built using QGIS, this map bypasses simple geometric circles to show how we actually walk, using the real street network.
Victoria Station (Red): A realistic 15-minute walk, showing true local accessibility based on the "15-minute city" concept.
Big Ben (Blue): Actual walking distances at 0.5km, 1km, and 2km intervals.
It’s a great way to see how urban design and natural barriers, like the River Thames, actively shape how we move between these two iconic London hubs.

Inspired by these results?